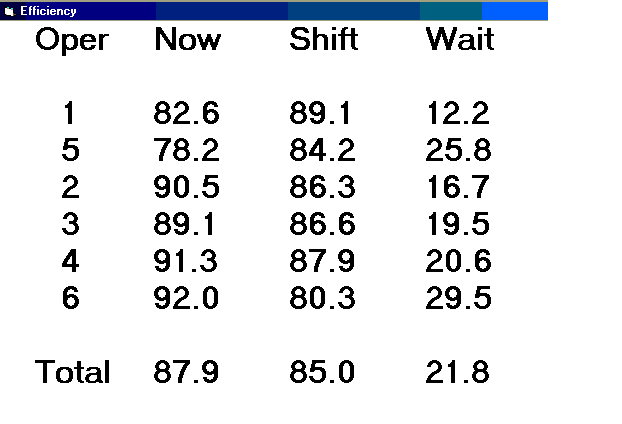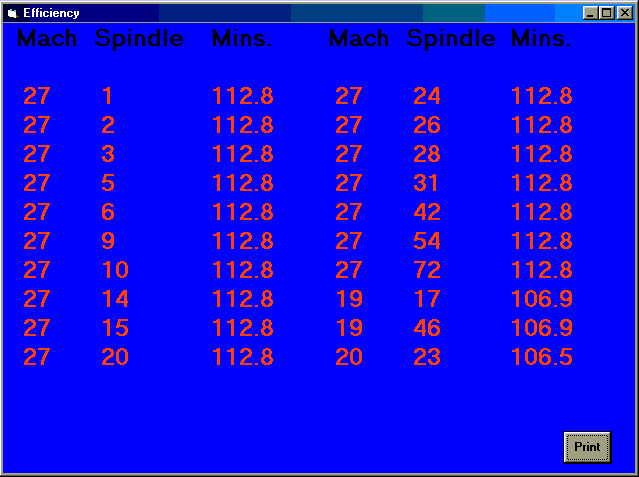
Activate the Display menu item and the following screen appears:

This screen shows the efficiencies by operator group. Click within this screen and another screen appears:

This screen shows 20 spindles that have been in the same stopped state the longest. Spindles that
are down for maintenance are excluded from this list. The above two display screen will alternate
every two minutes.
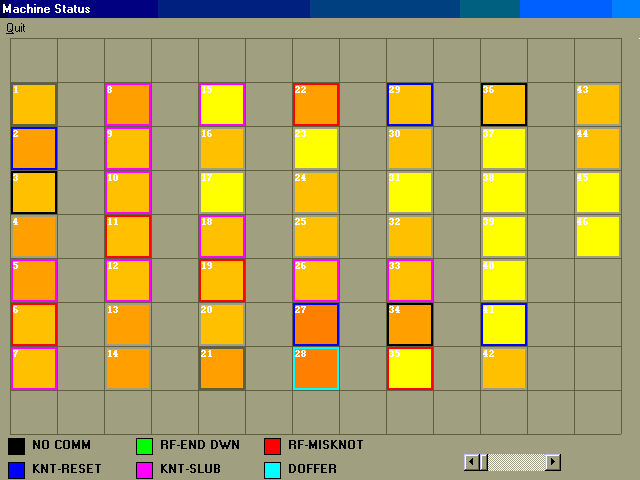
To view the current machine status, activate the status menu item. The following screen appears:

Here, the machine efficiency is also indicated by color. The border color indicates something else. As shown by the color code at the bottom of the status screen, a black border means there was a communication problem with the machine on the last scan. A green border means there are five or more spindles with a red flag end down. A violet border indicates five or more spindles waiting for the knotter after a slub.
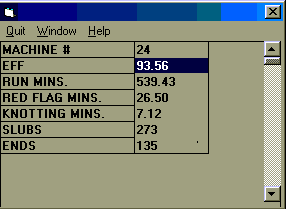
To zoom in on a machine, click the icon for the desired machine. A popup window appears displaying various information about the machine.
